Introduction
Trifactor Technical Sales and Services Limited (TRIFACTOR) is a sales and services company established to provide products and services that support the maintenance and construction activities of customers in the petrochemical, refining, steel, oil and gas, commercial, manufacturing, industrial and renewable energy sectors.
Our people have over twenty‐two (22) years of experience in the sales and services business in Trinidad, with specialization in renewable energy products and services, including supply of solar generators, solar water heaters, solar lighting, and installation, maintenance, and troubleshooting services.
Our people have established themselves as experts in their fields in the residential, commercial and industrial landscape in Trinidad and Tobago and are well known for providing the required products and services at the best value, on schedule, and while meeting and surpassing all quality and safety standards
Agile8 Consulting Co. Ltd is a British‐owned company based in Hong Kong, whose core business is environmental management, climate control and energy optimization areas. They have developed, certified and currently manufacture one of the world’s best AI‐based energy‐saving technology for cooling systems, internationally patented COOLNOMIX® products.
TRIFACTOR is the authorized representative and major distributor for all Agile8 products and engineering services in the Caribbean.
COOLNOMIX™ ® ORS®, is a NEVER‐BEFORE SEEN technology in the Caribbean, proven to reduce the cost associated with air conditioning systems by about 20‐50%*.
It utilizes a patented algorithmic energy‐optimization control methodology, ORS, which stands for Optimized Refrigerant Supply. Incorporating two temperature sensors, it monitors the thermodynamic (room temperature) and the hydraulic (refrigerant supply) performance of the cooling system to eliminate periods of unnecessary work by the AC system. Coolnomix can be retrofitted to any unit to ensure better temperature control, reduction in energy wastage and optimization of unit performance.
Trial Objective
The objective put forward by Agile8 is to reduce the worldwide operating costs of refrigerant‐ based cooling systems by an average of 30%, which by extension would help companies reduce their carbon footprint and become more environmentally responsible. Trifactor has taken on that goal and intends to implement it throughout Trinidad and the Caribbean. In order to do so, the goal is to deliver an efficient technology that eliminates energy wastage, while maintaining comfortable and productive working environments.
Trial Objective: To determine whether the Coolnomix Technology produces energy savings at PROMAN CNC Shared Office in the Maintenance Building.
This project seeks to obtain an idea of energy savings for a pioneer project in the oil and gas industry in Trinidad and Tobago, with Trifactor partnering with PROMAN CNC to ascertain the actual energy savings and to improve implementation and other strategies moving forward in reducing the company’s and the industry’s carbon footprint.
Methodology
The trial was executed as follows:
- A COOLNOMIX unit was installed as closely as possible to the respective Fan Coil Unit (FCU) and connected via the FCU’s existing thermistor using the COOLNOMIX series‐ connection method. This is done for each of the Air‐condition unit(s) installed in the common area.
- The Efergy Monitoring Device(s) were connected to the (L‐N) line to neutral wires/cables in the two separate electrical panels of the building for the respective AC units.
- The COOLNOMIX set point was set to 25 degrees Celsius and the air conditioning set point was set at 24 degrees Celsius.
- The AC unit was monitored for sixty‐one (61) days (October 2022 and November 2022) with the Coolnomix unit OFF.
- Following this period of observation, the COOLNOMIX unit was turned on and observed for thirty‐one (31) days.
- The results were downloaded from the Efergy website and raw data was sorted for the three aircon units with Coolnomix ON and separately with Coolnomix OFF.
- Graphical representations of energy usage were also downloaded from Efergy. Some of these can be found in Results and Discussion section, and the rest in appendices.
- All results were tabulated and pertinent results were graphed for ease of analysis. These graphs can also be found in Results and Discussion section.
- Conclusions were then formulated based on the results.
- Recommendations were then made based on the conclusions and discussion points.
Results and Discussion
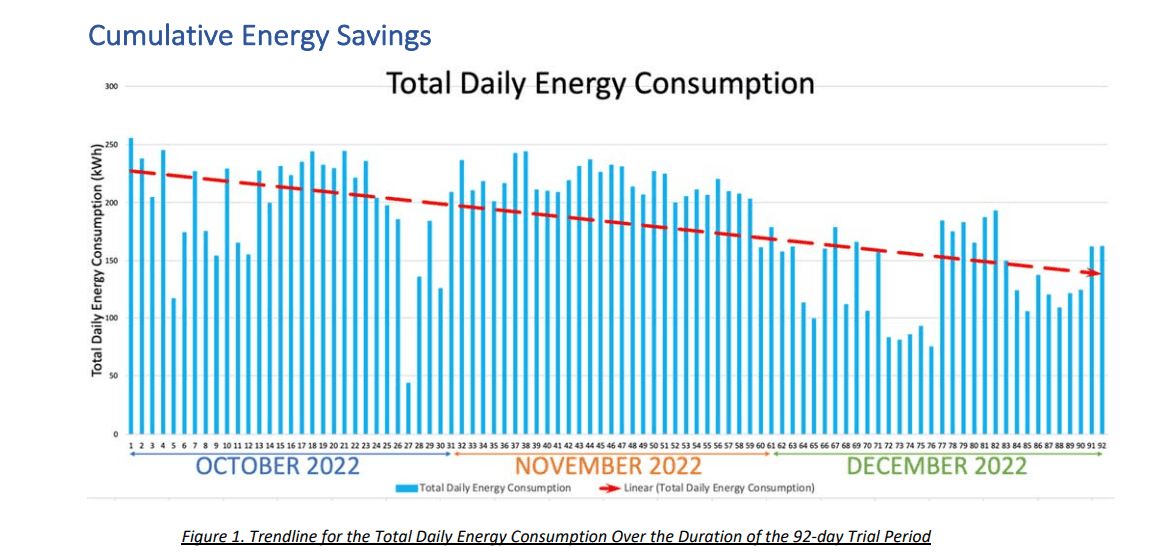
The total energy consumption for all three (3) units daily, for each day of the trial period was graphed and analyzed in Figure 1 above. The trendline shows a general decrease in daily energy consumption and shows that December 2022 (Coolnomix ON) was the month with the lowest overall energy consumption levels.
An important point to note is that there were missing data for certain units on different days and different time. This was due to the procedure not being properly followed by the staff occupying the office. The data used to do the comparison and analysis was chosen using different criteria. The main factor when choosing the standard time period to compare was that there should be values for every unit at every hour in that period. The other factor was that the time period remains consistent throughout all the days used to compare. By trying to keep as many factors as possible constant, we eradicate the random error, and the results of the comparison would have a higher validity and accuracy.
The data from each AC unit, for each day was averaged and graphed as can be shown in Figure 2 below.
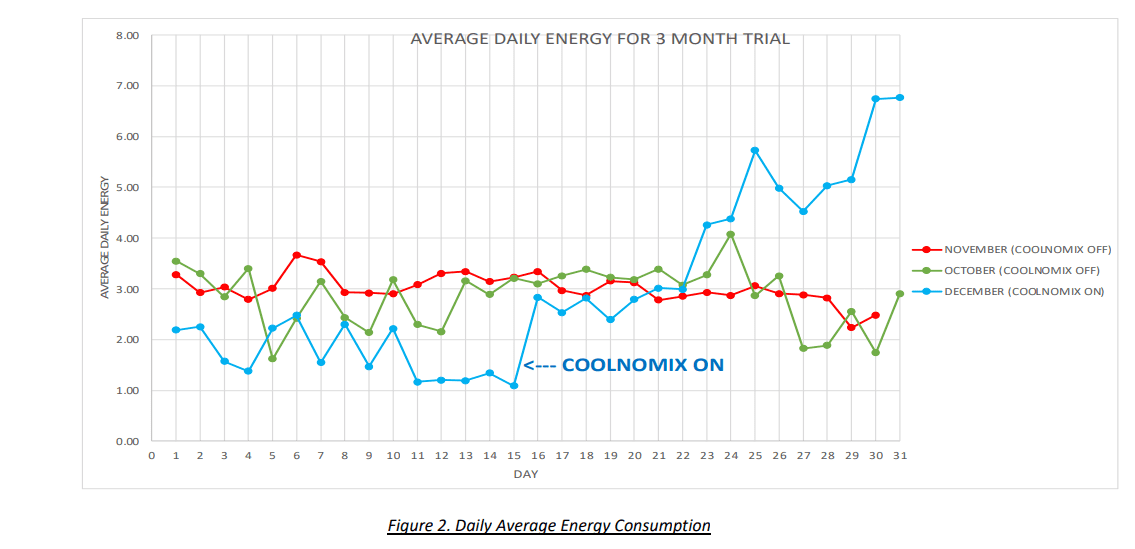
These results shown are for the daily average. The daily average was determined from the cumulated values from the three air condition units. These values were taken using the Efergy hourly data for each of the three (3) units in the shared office space and this data was summed and then averaged.
The success and accuracy of this trial depended on all three units being on simultaneously. Based on the premise that the three units were appropriately sized so as to provide sufficient cooling for the area considered, turning off one or two AC units would result in the remaining unit or units trying to cool an area greater than their design cooling capacity would allow for, resulting in the unit/units not cycling as they were intended to do.
It is a common misconception that turning off one or two AC units is beneficial. This is not true since, in this case, it caused the remaining units to struggle and it means that one or both units are being overworked in order to reduce the space temperature to the desired temperature. This results in an increased energy consumption.
From figure 2, we can see that the December graph, when the Coolnomix technology was used, is the month with the least energy consumption prior to the 22nd day. The reason for the spike in the values after the 22nd day is that there was only one AC unit on and therefore that unit was being overworked and the average of the one‐unit result in high values. This is as a direct result of not adhering to the instructions provided.
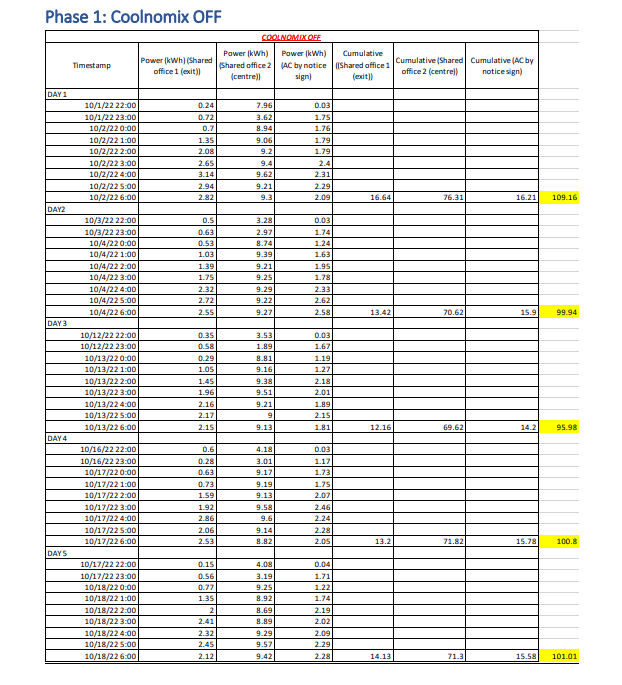
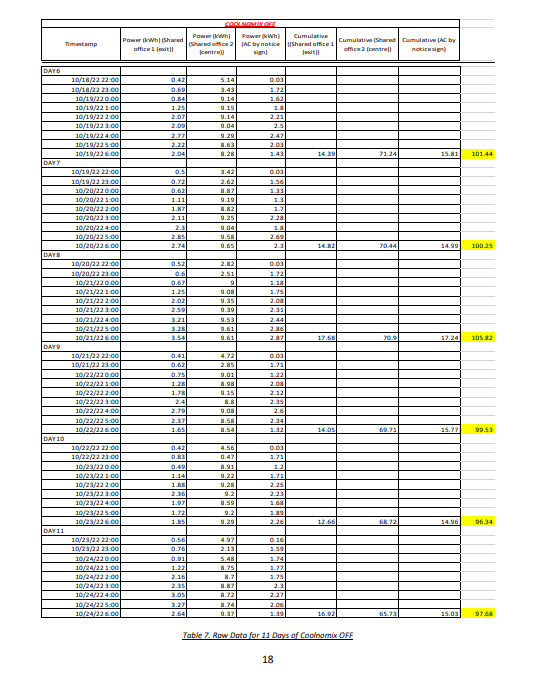
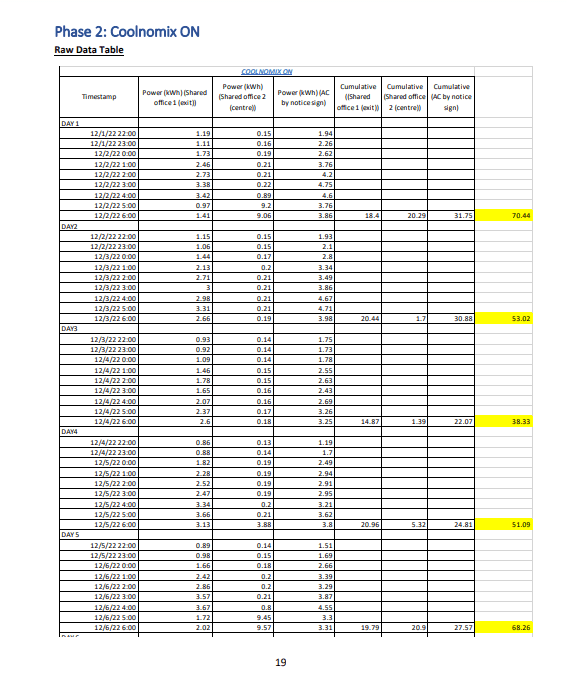
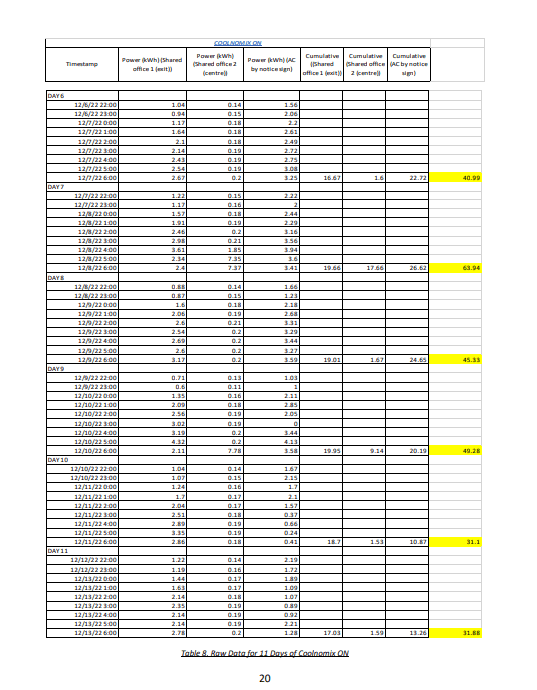
Eleven Day Comparison
To get the most accurate comparison, there were eleven (11) days that were extracted from each phase (Coolnomix on and Coolnomix off) and used to show our findings. These eleven days were chosen as they eliminated different factors of human and external error, as they kept the influencing factors constant in every day. The error due to the human factor was eliminated, as on each of these days, the proper guidelines were followed with all units on and data recorded hourly. The external error of different weather conditions was eliminated as we chose the same 8 hour period for every day (between 10pm and 6am).
The refined results containing the comparable eleven days were tabulated in Table 2 below.
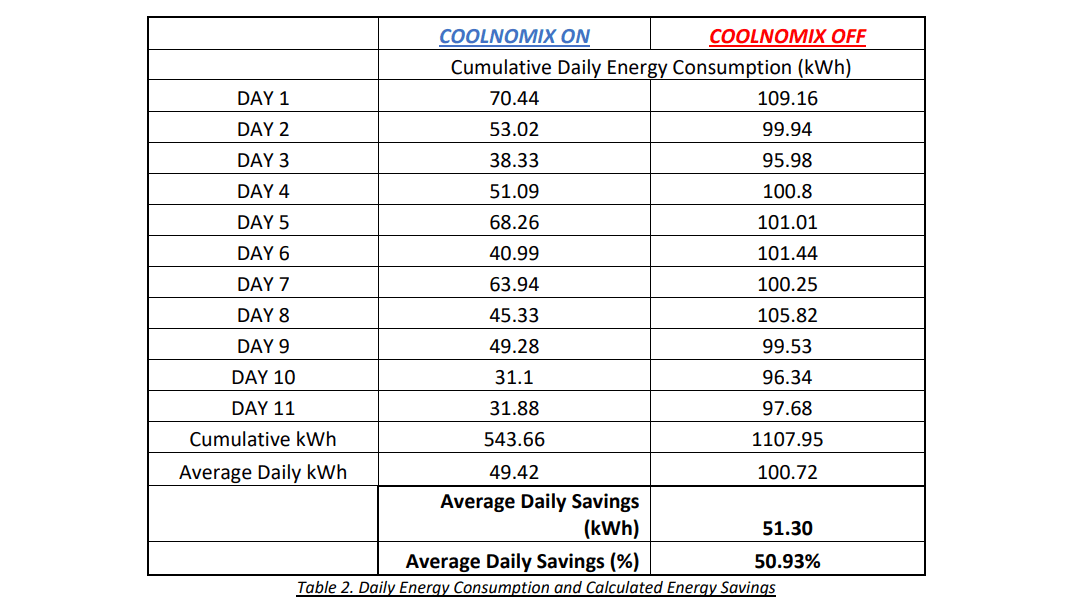
Cumulative Energy consumption was calculated by summing the hourly energy consumption of all three AC units for each day of the trial period.
The average daily savings were then calculated and the average daily % savings was calculated using the formula:
𝐶𝑜𝑜𝑙𝑛𝑜𝑚𝑖𝑥 𝑂𝐹𝐹 െ 𝑐𝑜𝑜𝑙𝑛𝑜𝑚𝑖𝑥 𝑂𝑁 𝐶𝑜𝑜𝑙𝑛𝑜𝑚𝑖𝑥 𝑂𝐹𝐹 ∗ 100
These results showed a total of 564.29 kWh saved over the eleven (11) day period with an average of 51.30 kWh being saved every day. This is approximately 51% energy savings daily.
The side‐by‐side graphical comparison is shown in Figure 3 below to easily visualize the savings with the Coolnomix technology.
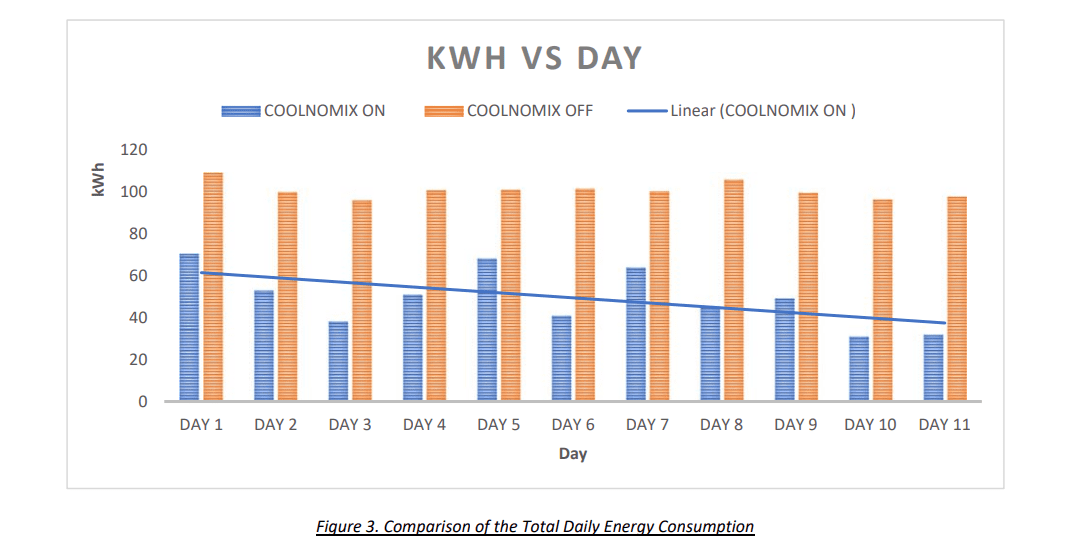
The linear trendline in the figure above projects a small but continuous reduction in energy savings throughout the time that Coolnomix was ON. This can result in a projected continuous decrease in kWh consumption when Coolnomix is turned on.
Maximum and Minimum Savings
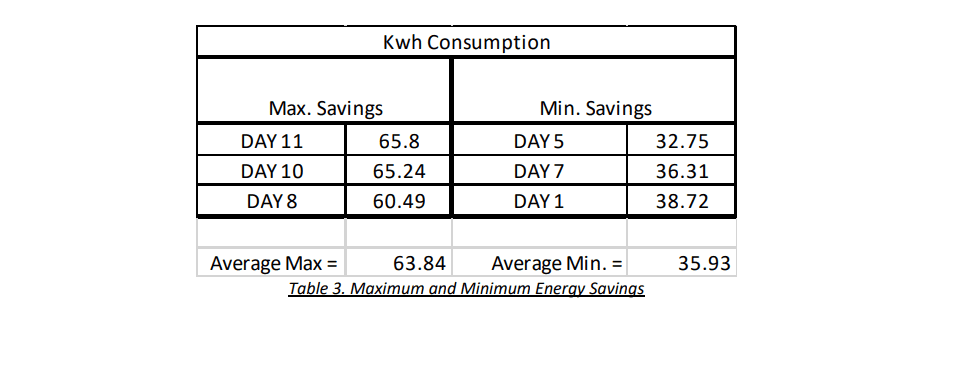
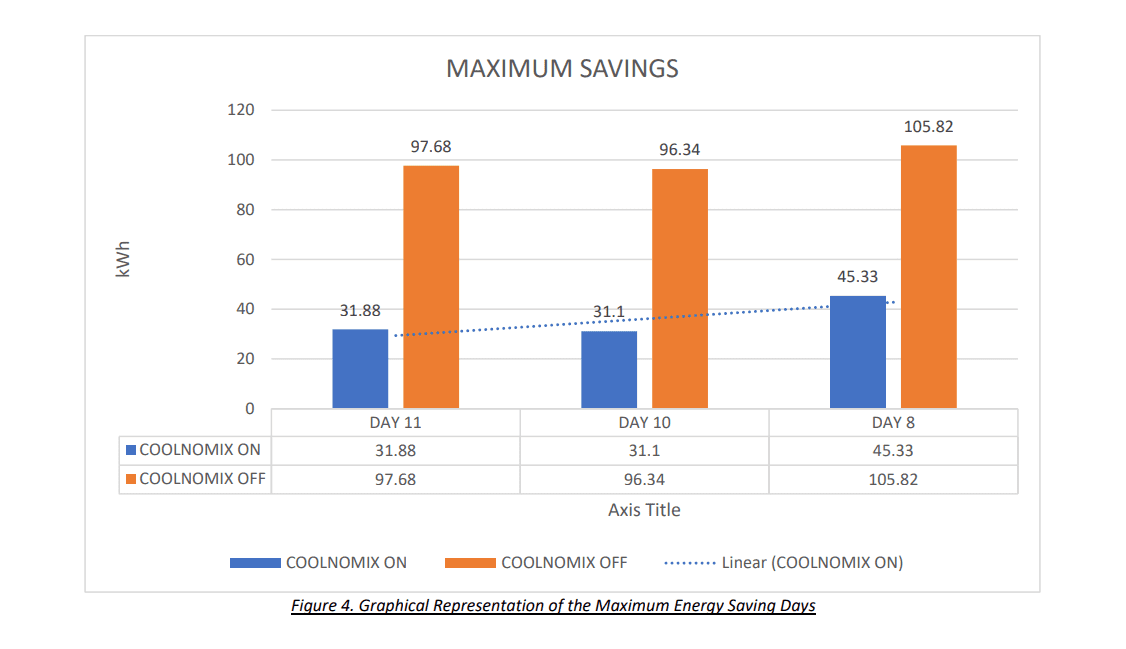
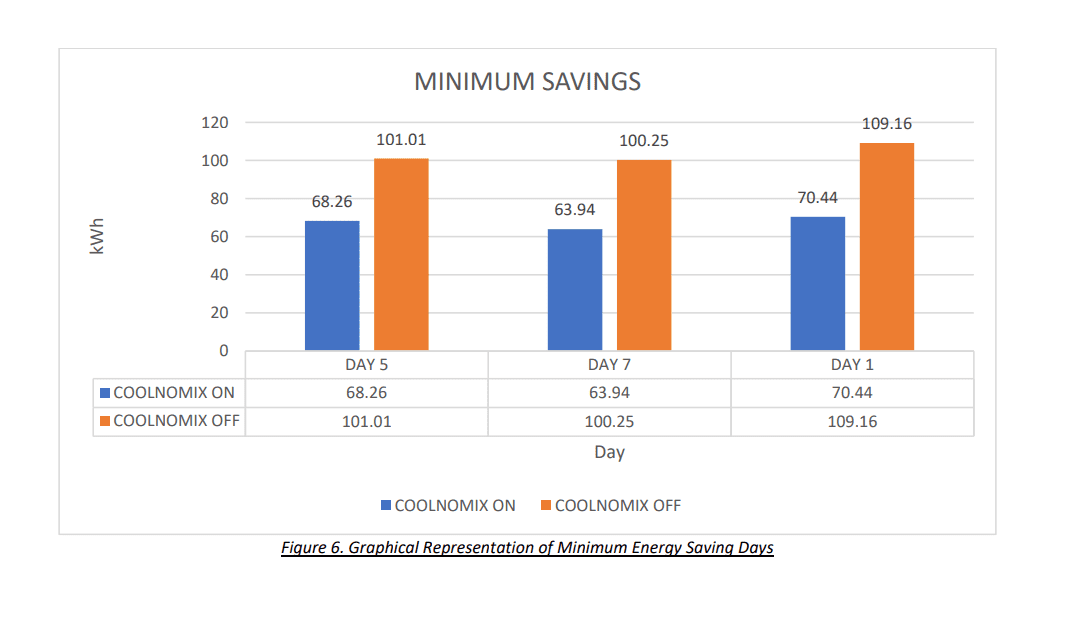
From these figures, we can observe that the use of Coolnomix technology has resulted in energy being saved in every single day that the trial was run. In the days of least energy savings, there was still an average of 35.9 kWh being saved per day, and based on our trial, this can go up to an average of 63.84 kWh being saved each day.
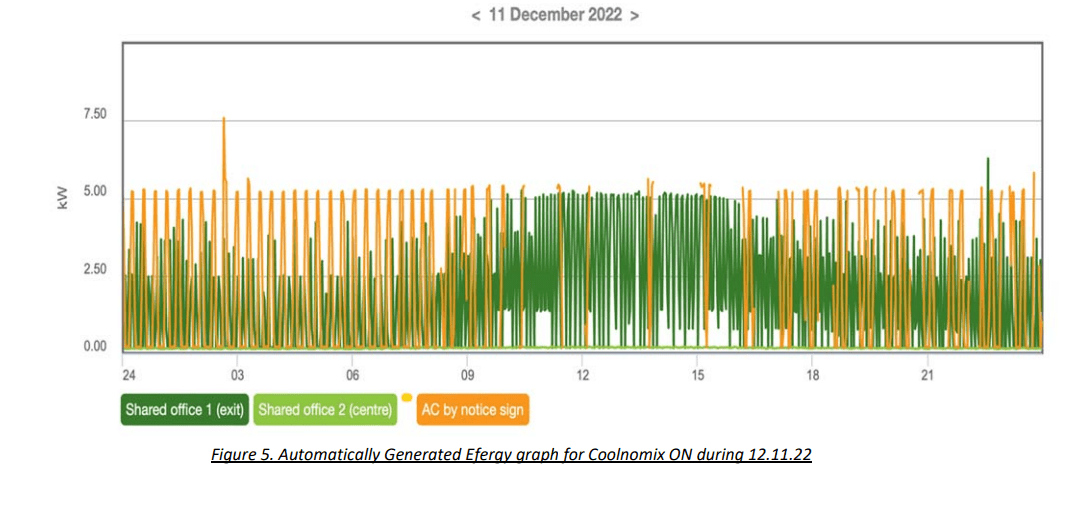
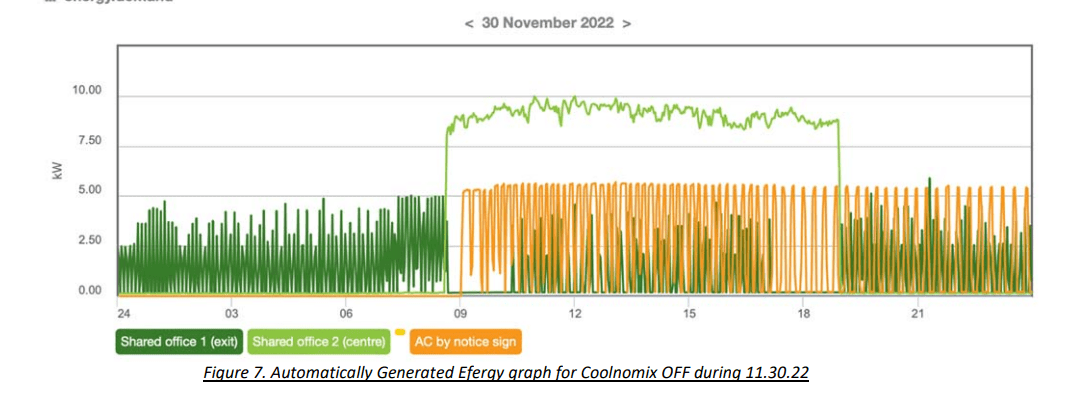
The automatically generated Efergy graphs are using the exact, raw data points for the entire day. The Efergy graphs shown in Figures 5 & 7, are selected to visually display the difference in energy consumption on a specific day with Coolnomix On and another day with Coolnomix Off. The plot of each unit is shown in these graphs and it is apparent that there is a higher maximum value of energy consumption in Figure 7 whereas a generally low and constant energy consumption for the day in which Coolnomix technology was used.
Daytime Comparison
One factor that was attempted to make constant, was the climate and time of day factor. Due to the limited data gathered during the daytime for all three units simultaneously, it was decided to extract only one day from each phase that had enough data to make a fair comparison. This comparison can be shown in the tables and figures below.
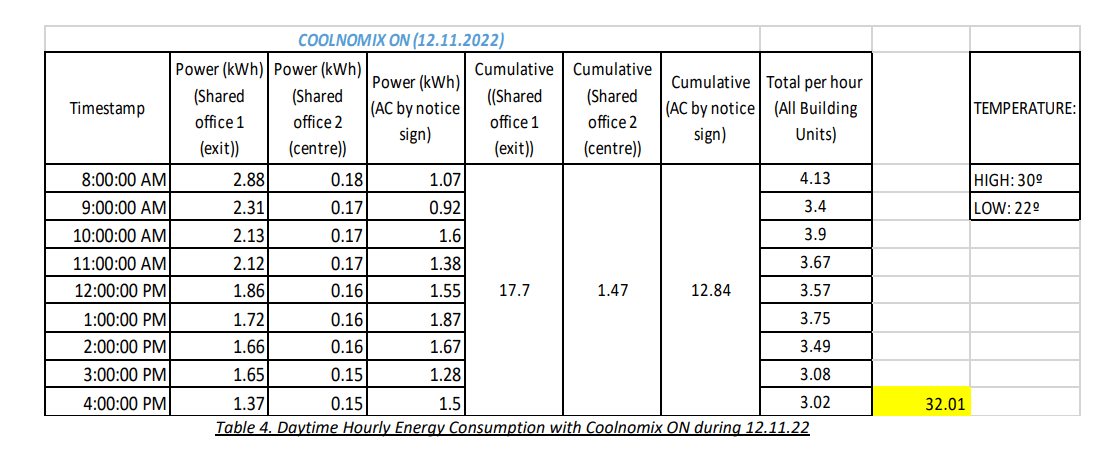
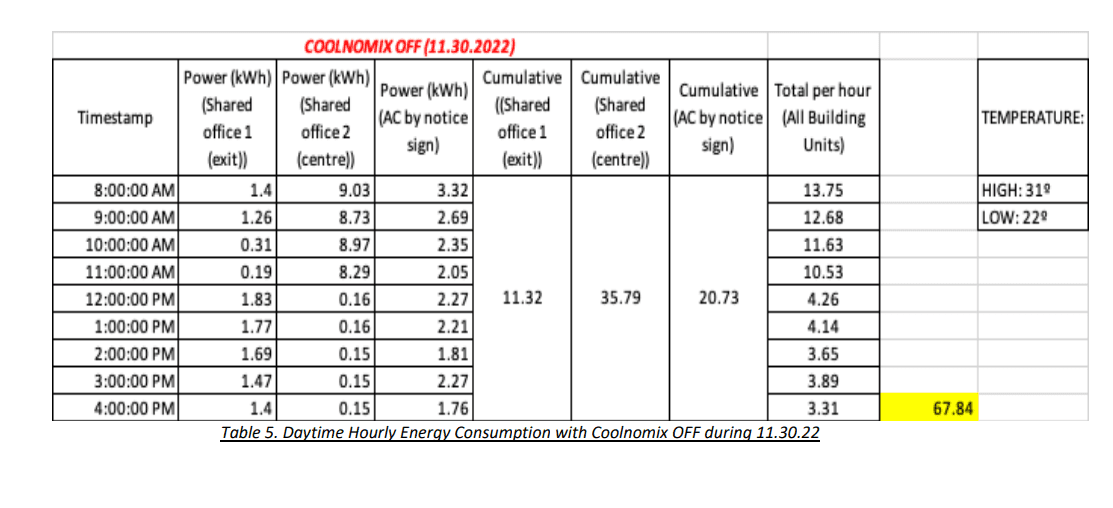
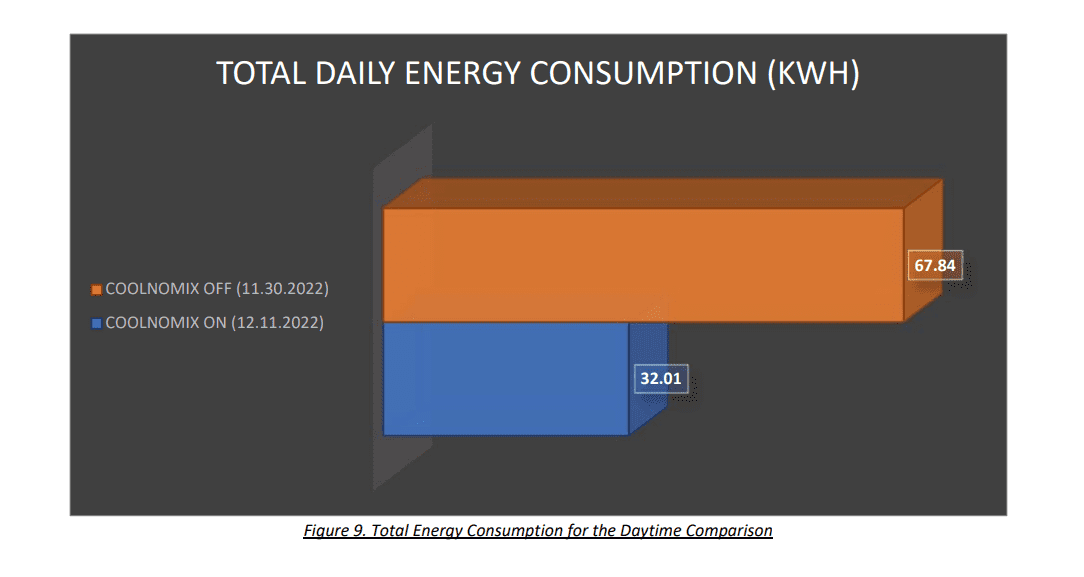
These days were singled out because they held the most variables constant and were comparable in every aspect. The time period, weather, number of AC units on, and data input were all the constant factors used for each day. November 30th, 2022 was the chosen day to use as the Coolnomix Off comparison, while December 11th, 2022 was the day for Coolnomix On.
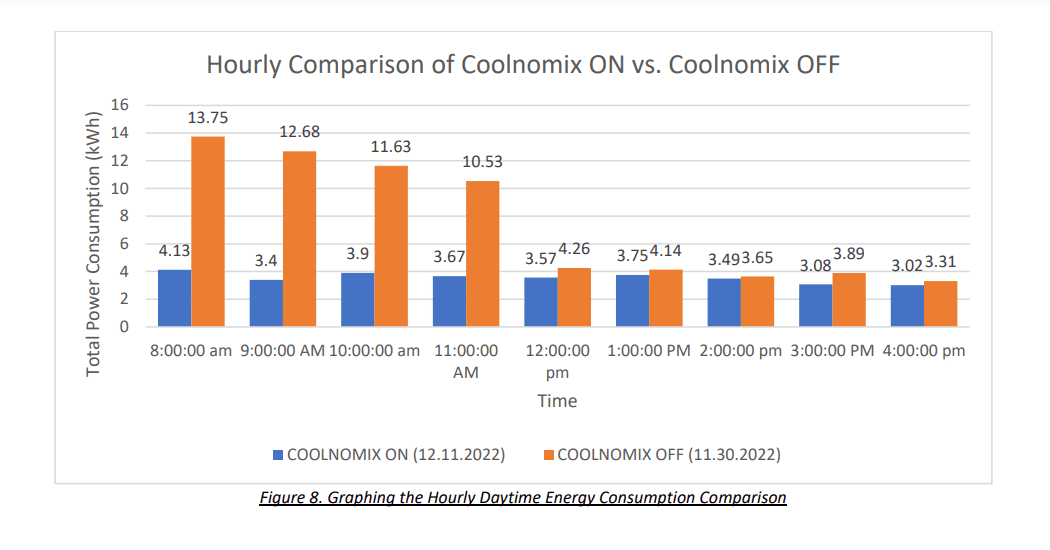
Based on Figure 8 above, there is a higher energy consumption in the morning between 8:00am – 11:00am. The Coolnomix technology has reduced the energy usage in the morning by more than 60% every hour before midday. As the day progresses, the savings per hour reduces, but there is a constant energy saving hourly for the duration of the working day.
As can be seen in Figure 9, the Coolnomix On saved 35.83kWh, which is 52.8% energy savings between the hours of 8:00am – 4:00pm. These are generally the working hours of any business and when there would be the most bodies and heat within a building for AC units to cool down.
ROI Analysis
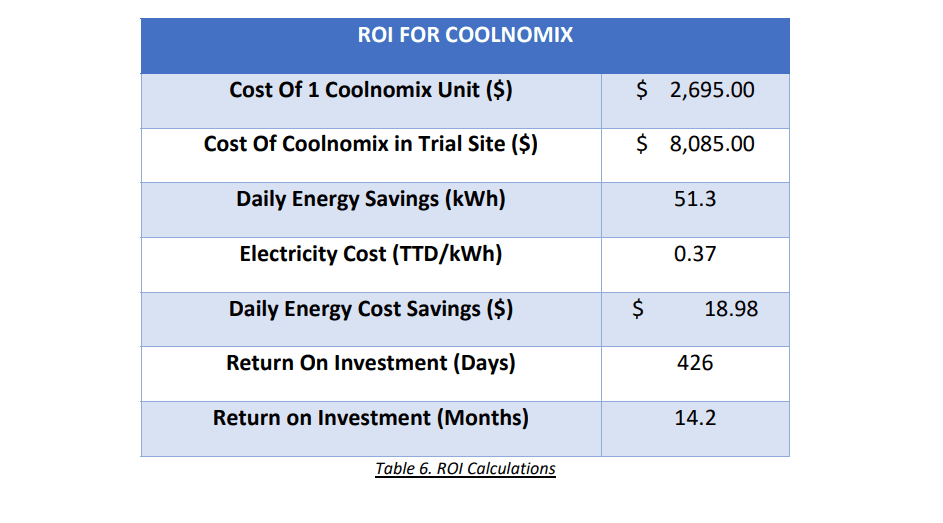
As per this report, the average daily savings was 51.30 kWh for all three units at the PROMAN CNC Shared Office in the Maintenance Building. Using an industrial rate, the cost of electricity is TTD$0.37 per kWh. This gives us $18.98 daily savings on average. Considering the cost of the Coolnomix technology, as well as installation for the three units, it was calculated that the Return On Investment for that specific building, would be 14.2 months. Given that the average lifespan of Coolnomix is ten (10) years, these results show that the product will yield profits more than 8 times over. These results can be seen in Table 6 below.
Conclusion and Recommendations
In conclusion, this trial run was successful in showing that Coolnomix produces energy savings at PROMAN CNC Shared Office in the Maintenance Building. The results showed a total of 564.29 kWh saved over the eleven (11) day period with an average of 51.30 kWh being saved every day. This approximates to a 51% daily energy savings. This trial far exceeded the expected goal of Agile8 to reduce the worldwide operating costs of refrigerant‐based cooling systems by an average of 30%. And although the data used to do the in‐depth analysis was limited due to the guidelines not being adhered to, which forced the trial period to evaluate and compare data for eleven days for each phase, rather than the entire month it is conclusive that a minimum of 51% energy savings was derived for that stated period. This simply implies that in order for Coolnomix to be successful, there must be a level of compliance to the guidelines provided. Such guidelines include ensuring that all AC units are running simultaneously as to not put unnecessary strain on any one unit.
RECOMMENDATIONS:
With these observations, Trifactor recommends, the installation of a Coolnomix Unit on each air‐condition Unit. This can be done in a modular project implementation phase, but must be done with simple rules;
- A Coolnomix Unit must be installed on each air‐condition Unit installed in any one common area.
- All the units must be on at all times.
DISCLAIMER:
- Installation of each Coolnomix Unit takes approximately 20 minutes.
- All units must be properly serviced and in good working condition.
- All units must be properly sized for the allocated space in which it is installed.
Appendix 1 ‐ Daily Energy Consumption