1. INTRODUCTION
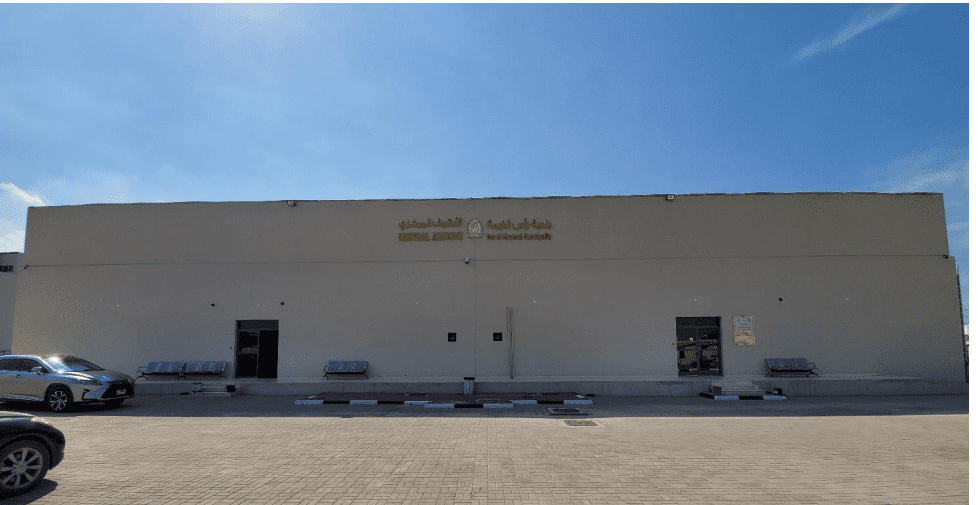
The Coolnomix performance study was performed at RAK Municipality Central Archive building on January 16th to January 30th 2020. The Complex is located in Ras al khaimah near Tower link golf club, UAE.
The building is a Single level structure. The building equally partitioned to two blocks. First block consist of multiple office cabinets and majority of the area is occupied with racks that are used to store documents. The second block is fully occupied with racks and documents. The complex is oriented towards south-east direction. The facility air conditioning primarily consists of package units and all the units are located on both sides of the building.
A detailed survey was performed to understand the distribution of air conditioning units. Each bloc is served by two package units. We selected one package unit (PU-1) which was serving the second block which contains only racks and documents. A two weeks energy logging was carried out in the facility to understand the electrical
consumption and working philosophy of the AC units with and without Coolnomix controller. Good potential for energy saving has been identified with the Coolnomix controller. The observations and key findings have been presented in this report.
The specifications of package unit and the loggers used for energy logging is as follows.
1.1Equipment Details
| Package Unit Details (PU-2) | TRANE- TSC120EDR0A1F, 11.3 kW, 10 TR, Two stage compressor |
| Energy Logger Details | FLUKE 1730 & 1736, Three phase energy logger |
2. Energy Analysis (Without Coolnomix)
The operation philosophy of package unit PU-1 with space temperature setpoint as 220C for a period of six days is as follows
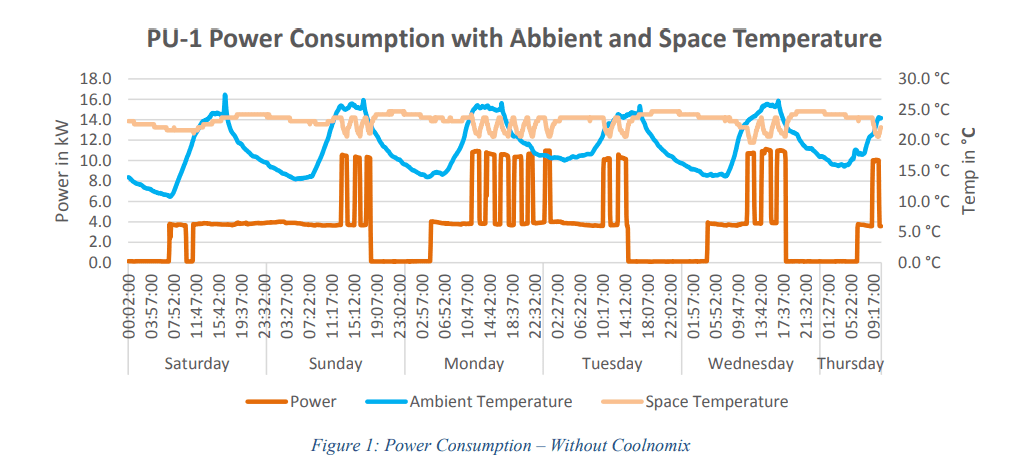
Input power is observed to have recurrent peaks of 10.8 kW on typical Monday during early and late afternoon hours. As load stays more or less constant, ambient temperature is observed to have a higher correlation with measured power.
The total energy consumption of package unit, PU-1 for six days is 452.8 kWh
3. Energy Analysis (With Coolnomix)
After the installation of Coolnomix controller in the same units (PU-1), the operation philosophy was recorded as follows.
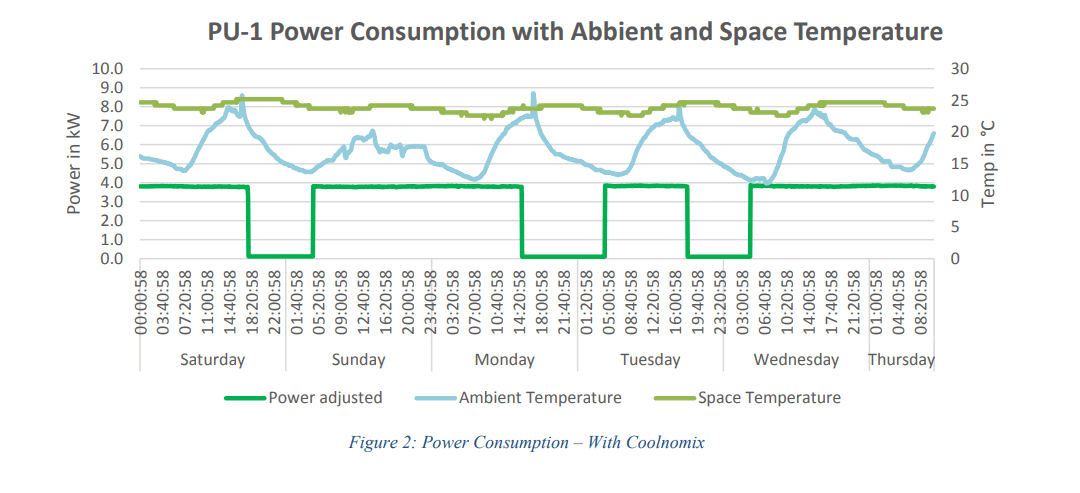
The compressor found to be in OFF position, as the space temperature maintained.
As Jan 27th data was missing from the post measurements (Siemens logger), we used our logger data for post measurements and also made a slight adjustment for correcting the instrument error(Increased 1.3 kW in the post-measurements)
The total energy consumption of package unit, PU-1 for one day is 245.4 kWh
4. Comparison of both the conditions
4.1 Operation Philosophy
The power consumption comparison of both the conditions are plotted below.
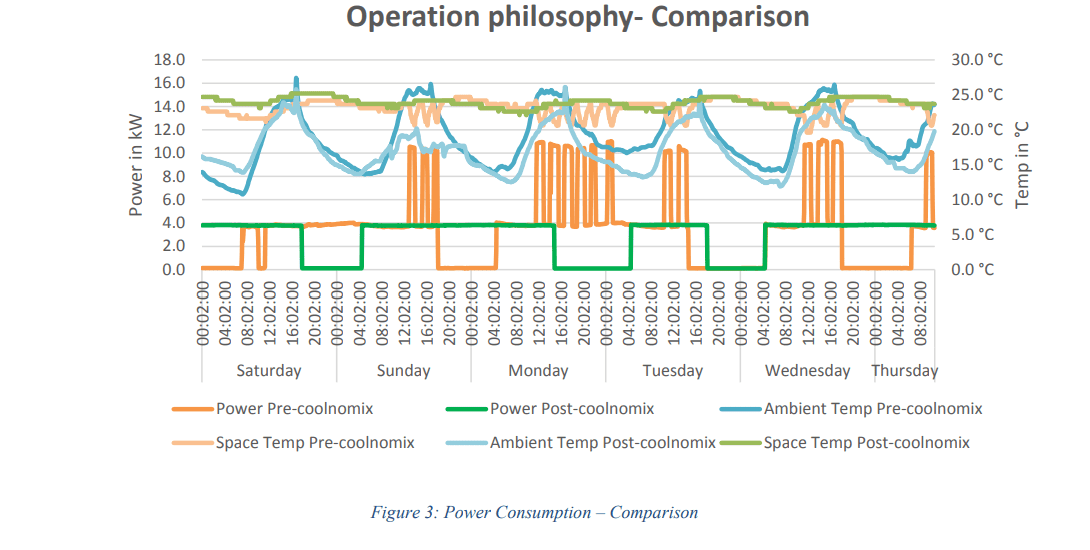
The graph plotted with power consumption (kW) and the time gives detailed information about the operation philosophy.
- Without coolnomix controller the operating time of the compressor is more.
- The compressor switching OFF is happening only after the space temperature reaches 18 0C, this can be controlled using Coolnomix controller.
- As the space temperature is maintained using supply air circulation, the coolnomix controller, halts the compressor from switching ON.
4.2 Ambient Temperature
The activity involved recording ambient temperature for pre and post coolnomix installation. Further to this activity, daily average hours with respect to ambient temperature ranges were computed to validate unit operations in pre and post retrofit scenarios.
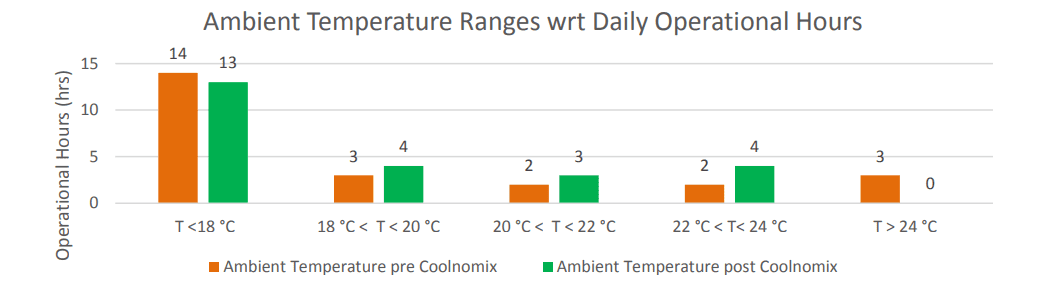
Observation:
1. Logged data as represented confirmed ambient temperatures above 24°C to be recorded as 3 hours for pre-coolnomix scenario and 0 hours for post coolnomix scenarios. This shows the weather conditions were much colder during postretrofit scenarios.
2. Considering space temperature set points are maintained at 22°C, total unit run hours pre coolnomix is computed to be 5 hours and unit run hours post coolnomix is computed to be 4 hours.
4.3 Energy Consumption
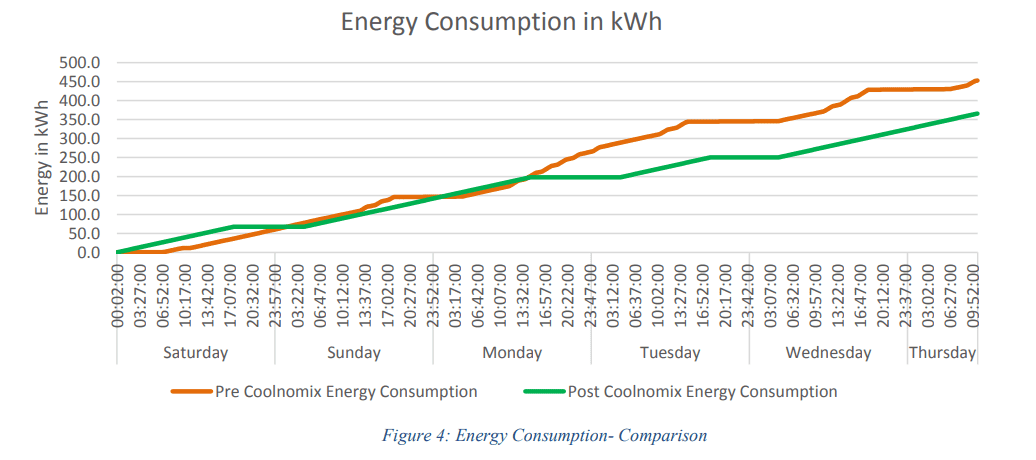
Total reduction in energy consumption while using coolnomix controller is 87.1 kWh
5. Conclusion
The pie chart provides details of energy consumption of the package unit in both condition with savings.
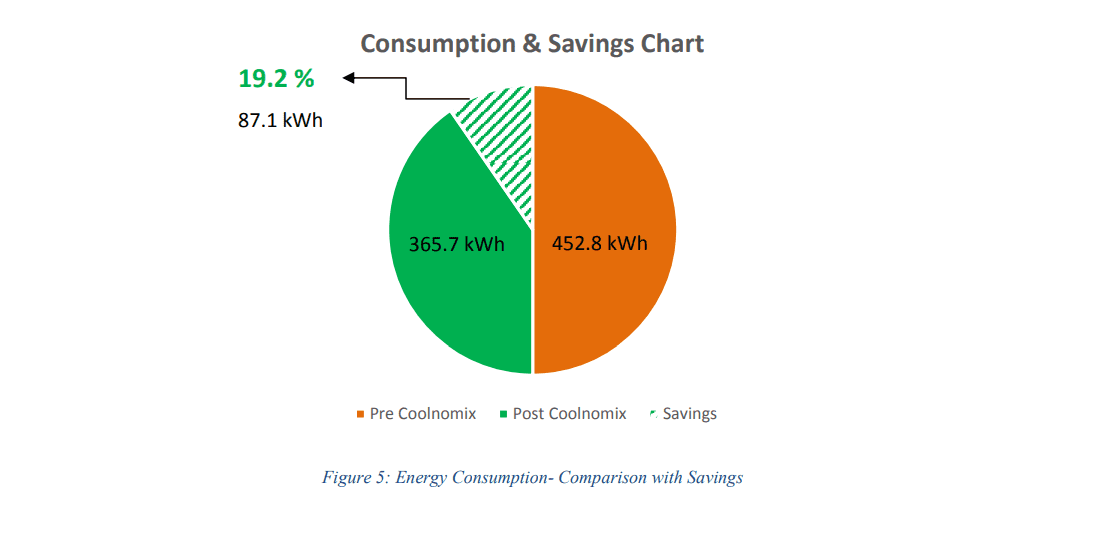
On the conclusion of studies at site and detailed analysis on measurements, there is a 19.2 % savings with coolnomix controller.